 |
| Data: IEA; Chart: Sara Wise/Axios |
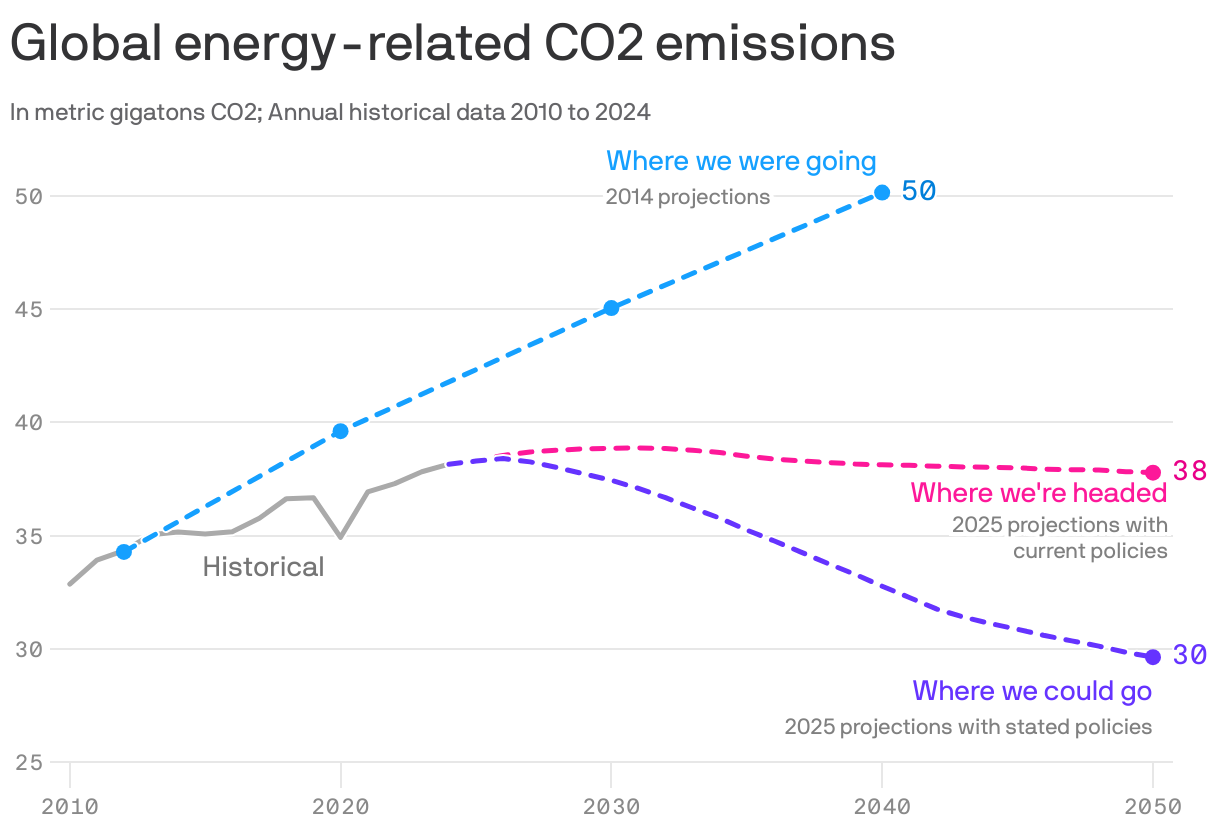
Axios- The chart above shows three different greenhouse gas emission scenarios from the International Energy Agency. .
- The top blue line shows what the IEA was predicting would happen with policies in place and under consideration back in 2014.
- The middle pink line shows what IEA is predicting today based upon policies currently in place.
- The lower purple line shows where emissions from the energy sector could go if policies under consideration are put in place.
Reality check: Even so, past performance doesn't dictate future results.
"There is no guarantee that we will take stronger action on climate change in the future. I hope we will. I think we will because that's been the trend over the last few decades," said Berkeley Earth climate scientist Zeke Hausfather in an interview.
- "If the 21st century is led by leaders who share ideology closer to the Trump administration, we won't."
The bottom line: The possible trajectories are better than a decade ago, but they still indicate significant global warming.
No comments:
Post a Comment